
🪴 Developing *a useful* growth model
And why you simply must build one

What is a growth model?
A growth model is a structured way to answer the fundamental question: "How does our business grow?" It should provide clarity on the strategies and metrics to drive sustainable growth.

“Growth isn’t about hacks; it’s about building a system where every experiment teaches you something about your users. At Dropbox, referrals worked because we measured what made users stick around first.”
Sean Ellis, Growth @ Dropbox
A growth model gives your startup a clear plan to scale without wasting time or money. It shows you exactly which strategies and metrics matter most, like improving onboarding or boosting repeat customers, so you stop guessing and can focus on what drives the actual results.
It keeps your team aligned on a single goal, like Etsy’s focus on “items sold,” avoiding distractions like random marketing stunts. By highlighting what’s working and what’s not, it lets you make smart, data-backed decisions instead of guessing, setting up your business for long-term growth.
The emphasis here is on keeping the growth model up to date, because it can grow irrelevant after the smallest of changes.
New Report: How Startups Hit $1M ARR Faster with OKRs

New data from 200 early-stage teams shows OKRs aren’t just a framework - they’re a growth accelerator. The 2025 Startup OKR Report reveals how small teams are using OKRs to stay focused, align faster, and hit major milestones - often in under 90 days.
Read the full report to learn more.
Identifying your growth levers
Your growth model starts with finding the specific actions and metrics that drive your business forward, called growth levers. These are things like acquiring new users, improving onboarding, or increasing repeat purchases.
To identify them, break your business into five areas:
Acquisition (how users find you)
Activation (when users first get value)
Retention (keeping users coming back)
Monetisation (how you make money)
and a North Star metric (the one number that shows your product’s value, like Airbnb’s “nights booked”)
List out what moves each area, like SEO for acquisition or a referral program for retention, and test them to see what works and focus on that basket (80/20 at its best).
Check these levers every quarter (or more often) — small changes, like a new feature or competitor move, can make them less effective, so update them to stay on track.
Choosing your north star metric
To pick it, start by asking what action users take when they get the most value. Make sure it ties to revenue and reflects long-term growth, not just short-term wins (because of fluctuations).
Test it by tracking it for a period of time to see if it aligns with user behaviour. Avoid vanity metrics like total signups or page views, they might look impressive but only mislead your focus in the end.
Good metrics examples: These show real user value, tie to revenue, and guide your growth model.
Retention rate: Percentage of users returning after their first interaction (e.g., monthly active users for a SaaS). Shows if your product keeps users engaged.
Revenue per user: Average revenue from each active user (e.g., subscription fees). Links directly to business health.
Activation rate: Percentage of users hitting the “aha” moment, like completing a purchase or profile setup. Measures how well your onboarding delivers value.
Referral rate: Percentage of users inviting others (e.g., Dropbox’s referral program). Drives compounding growth through loops.
Bad metrics examples: These might look impressive but don’t show true growth or value.
Total signups: Raw user counts ignore whether users stay or engage (e.g., many signups churn fast).
Page views: High traffic doesn’t mean users are buying or returning.
Social media followers: Follower counts don’t guarantee revenue or engagement.
App downloads: Downloads without active usage (e.g., daily active users) are meaningless.
Impressions: Ad views don’t show if users took action or cared.
Note: North star metric should change as you progress with your startup. It shouldn’t stay the same for a pre-revenue startup and for a company that is currently preparing for an IPO.
Linear and non-linear growth models
Linear growth moves users through a funnel a loop, while non-linear growth creates loops where users bring in more users, like Slack’s members promoting their communities to drive invitees. These two fuel each other to scale your startup.
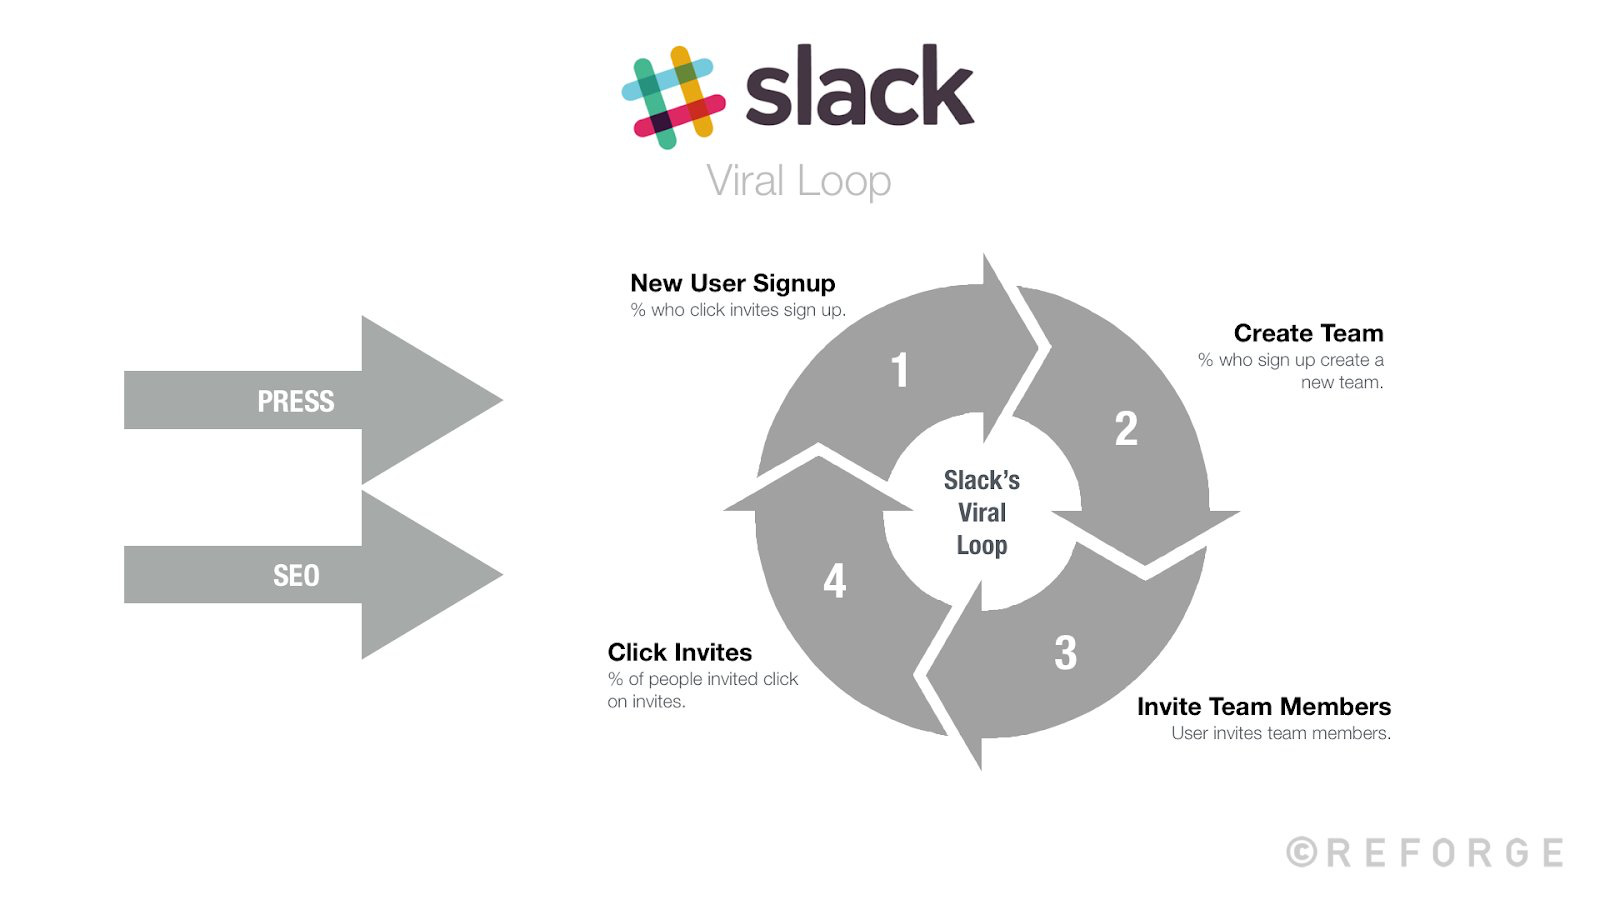
A solid funnel builds your initial user base, giving you enough engaged users to spark loops, such as a referral program or user-generated content. Loops then boost the funnel by pulling in new users who start the process again.
For instance, Uber’s funnel focused on rider signups, but its driver referral loop grew supply, making rides more available and attracting more riders.
Start with a linear funnel to get the basics right, like conversion rates, then layer on loops as you improve retention.
A growth model maps out how your startup scales, and you can build it as a linear funnel or a non-linear loop, depending on your goals. Linear models drive users through clear steps to a purchase, while non-linear models create cycles where users bring in more users.
Here’s how to build each, with steps to keep them working as your business changes.
Building a linear growth model
Linear growth models, or funnels, guide users from awareness to revenue in a straight path. They’re great for early startups to nail basics like onboarding or conversions. Follow these steps:
Map the user journey: List the stages users go through — awareness (finding you), acquisition (signing up), activation (getting value), retention (coming back), and monetisation (paying). For a SaaS like Slack, this might be ad click → signup → team invite → daily messages → paid plan.
Pick key metrics: Choose one metric per stage, like signup rate for acquisition or paid conversion rate for monetisation. Don’t forget to avoid vanity metrics.
Track and optimise: Use tools like Google Analytics or Mixpanel to measure each stage. Test changes, like tweaking onboarding emails, to boost weak spots. For example, Etsy optimised its funnel by improving search-to-purchase rates.
Update often: Sorry for shoving this down your throat every other paragraph but it’s really true. You should rather check it so often you don’t have to change anything, than to leave it unchecked for a longer period of time.
Note: I’ve had this reference in the newsletter 4-5 extra times that I dropped, not to push you to marking this edition as spam :skull:
Building a non-linear growth model
Non-linear growth models, or loops, rely on users driving more users, creating compounding growth. They’re ideal once you have solid retention. Here’s how to build one:
Identify a loop trigger: Find an action users take that brings in others, like sharing content or inviting friends. Dropbox’s referral program, where users invited friends for extra storage, is a classic loop.
Design the loop: Map how the action cycles back to growth. For Dropbox: user invites friend → friend signs up → friend invites others → more signups. Ensure the loop is simple and rewarding. The bigger you get, the cheaper it gets for you.
Measure loop efficiency: Track metrics like referral rate or viral coefficient (how many new users each user brings). Use tools like Amplitude to see if the loop sustains itself.
Test and refine: Experiment with incentives, like better rewards, to strengthen the loop. Airbnb’s referral loop grew by offering travel credits to both inviter and invitee. Founders often discourage incentivising directly with money (like Revolut does), because it attracts anti-network effects. It makes sense for financial entity to do it, otherwise highly discouraged.
Instead find something that works better for you (it often gets exponentially cheaper for you than the customer values it. Dropbox giving out 500 MB free storage per referral, valued by users like a $5-$10 win, but costing Dropbox under $0.01 annually per user).
Start with a linear model to build a user base, then add a non-linear loop to amplify growth. Combine them, like Uber did with its signup funnel and driver referral loop, and update them as your product or market evolves.
When to Update Your Growth Model
A growth model loses value if it doesn’t reflect your current business or market. Refresh it when you notice triggers like new features, competitor moves, or metrics that no longer align with your goals.
Instacart shifted focus to delivery speed when user feedback highlighted delays, adjusting retention levers to prioritise faster service.
Every three months, review your North Star metric, like Notion’s “pages created,” to confirm it still drives value. Next, evaluate your levers — acquisition, activation, retention, monetisation — for gaps, such as declining conversions after a price hike.
Test new strategies, like improved checkout flows, to address issues. Use Google Sheets for metric tracking or Figma for visual adjustments. These steps ensure your model stays relevant and impactful.
You’ve got the tools to build a growth model that drives your startup forward, now it’s time to put them to work. In the next edition, I’ll share how I’m crafting a growth model for my own startup, Unicourn, walking you through the real-world steps, wins, and challenges.
Got thoughts or questions? Hit reply and let’s talk growth!
If you’re finding this newsletter valuable, share it with a friend, and consider subscribing if you haven’t already.
How I can help
Software
Need a top tech talent for your next product? Are you looking for your next gig? I’ve got you sorted.
Advertising
Advertise in my newsletter to get in front of 10,000+ founders.